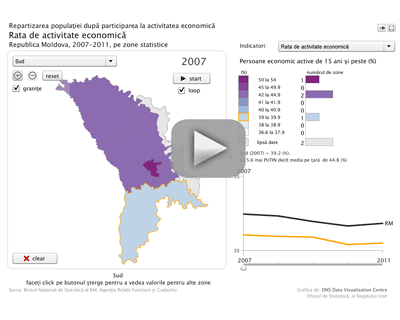
National Bureau of Statistics announces the posting on the official page old.statistica.md of three animated maps:
Animated data visualisation using this application presents the changes in territorial aspect of indicators that refer to:
- household amenities: hot water, mains gas, internal wc, mains drainage, bath or shower
- population density and number of resident population
- activity, employment and unemployment rates
We would like to mention, that the applications were developed in collaboration with Data Visualisation Centre of United Kingdom’s Office for National Statistics.
For the first time an animated map was launched in May 2012 that presented Vital statistics rates.
The animated maps can be accessed from the main page of the National Bureau of Statistics - old.statistica.md - banner Animated maps.


 Green line: 022 40 30 00