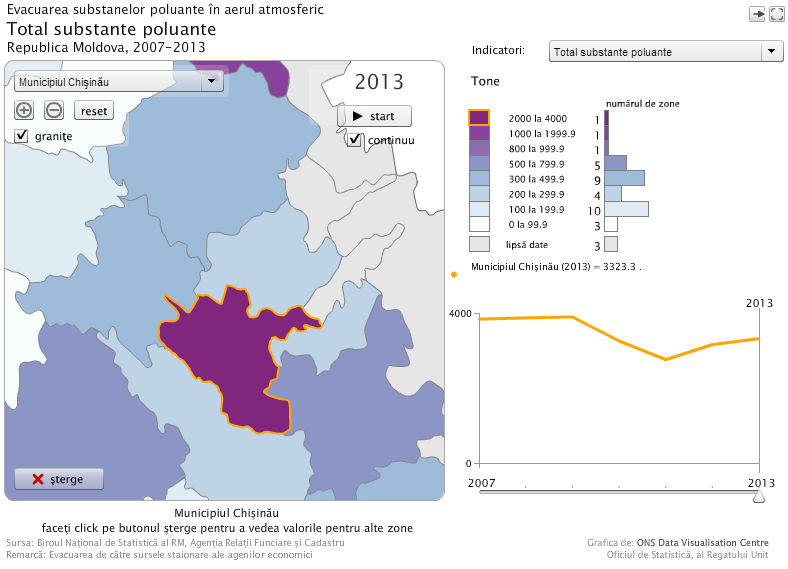
National Bureau of Statistics announces that a new animated map "Emission of polluted substances in atmospheric air" has been posted on the official page.
Animated data visualisation using this application presents the changes in territorial aspect of indicators related to emission of polluted substances in atmospheric air, including solid, gaseous and liquid substances from 2007 to the present.
The application was developed in collaboration with Data Visualisation Centre of United Kingdom’s Office for National Statistics.
To see the map, click on the picture. Various options will be described under the map on mouseover. You must have the browser plugin Flash installed in order to view the application.
The animated map can be accessed under the heading Products and services / Interactive products / Animated maps or under Statistics by themes / Geography and environment.
All interactive tools developed by NBS can be found under Interactive products heading.


 Green line: 022 40 30 00