RO RU EN
RSS feed
Updated: 03.08.2023
Home / Data visualisation
Animated map "Emission of polluted substances in atmospheric air"
Print version
 
Animated map "Emission of polluted substances in atmospheric air"

Animated data visualisation using this application presents the changes in territorial aspect of indicators related to emission of polluted substances in atmospheric air, including solid, gaseous and liquid substances  from 2007 to the present.

The application was developed in collaboration with Data Visualisation Centre of United Kingdom’s Office for National Statistics.

Technical specifications:

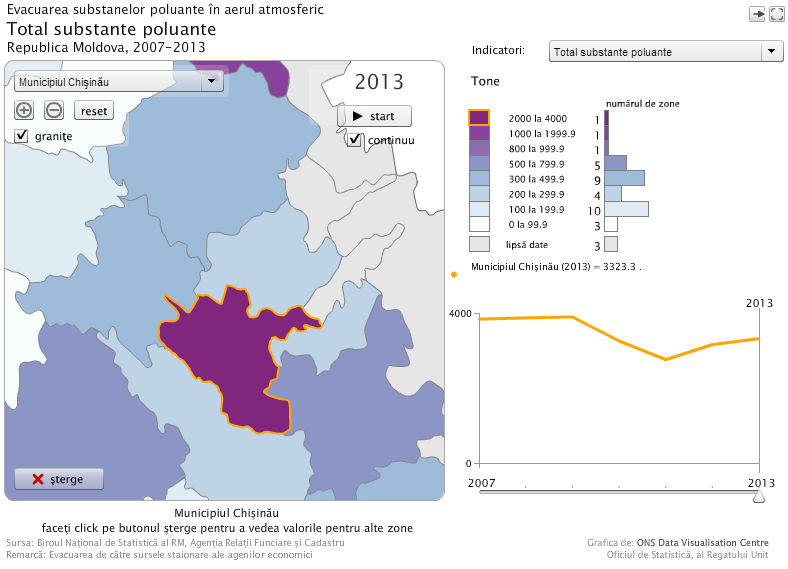
To see the map, click on the picture. Various options will be described under the map on mouseover. You must have the browser plugin Flash installed in order to view the application.

Useful links:


Home Contact Sitemap
 
Press releases  / Statistical databank  / Statistics by themes  / Products and services  / Censuses  / Metadata  / IMF's SDDS  / Sustainable Development Goals  /  About NBS  / International cooperation  /  News and events  / Useful links
Up
visitors during 30 days
 
Copyright © 2024 NATIONAL BUREAU OF STATISTICS OF THE REPUBLIC OF MOLDOVA
Terms of use
TRIMARAN - IT Solutions Company // web, interactive, motion and software development solutions // http://www.trimaran.md, B2B and B2C solutions  /  Branding & Graphic Design Services / Website Design and Development  /  E-Commerce Systems / Software Application Architecture and Development / Multimedia solutions  /  2D/3D modeling & animation solutions / Video & Post Production / contact@trimaran.md
Created by Trimaran