
Animated map "Vital statistics rates"
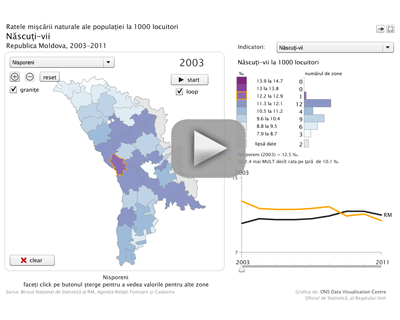 Animated data visualisation using this application presents the changes in territorial aspect of vital statistics indicators, namely: live births, deaths, natural increase, marriages, divorces, infant mortality, from 2003 to the present. Indicators are presented per 1000 population and infant mortality per 1000 live births.
The application was developed in collaboration with Data Visualisation Centre of United Kingdom’s Office for National Statistics.
Technical specifications:
To see the map, click on the picture. Various options will be described under the map on mouseover. You must have the browser plugin Flash installed in order to view the application.
Useful links: