
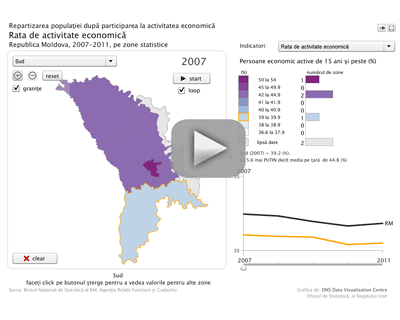
Animated map "Distribution of population by economic activity"
The application was developed in collaboration with Data Visualisation Centre of United Kingdom’s Office for National Statistics.
Technical specifications:
To see the map, click on the picture. Various options will be described under the map on mouseover. You must have the browser plugin Flash installed in order to view the application.
Note:
The statistical zones are classified as follows:
- municipality Chisinau
- North: districts Briceni, Edinet, Ocnita, Donduseni, Soroca, Drochia, Riscani, Glodeni, Falesti, Singerei, Floresti, Soldanesti and mun. Balti
- Centre: districts Ungheni, Telenesti, Rezina, Orhei, Calarasi, Nisporeni, Straseni, Criuleni, Dubasari, Anenii Noi, Ialoveni and Hincesti
- South: districts Leova, Cimislia, Basarabeasca, Causeni, Stefan Voda, Cantemir, Taraclia, Cahul and TAU Gagauzia
Useful links: